
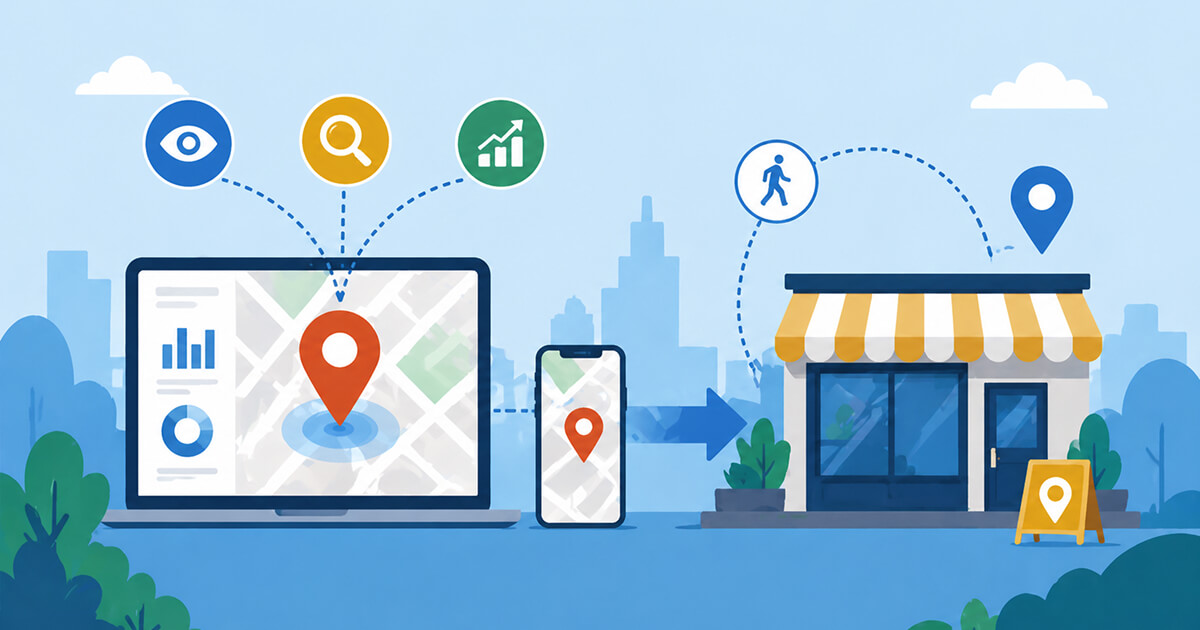
Online visibility means nothing if it doesn’t drive people through your physical doors. Foot traffic analytics bridges the gap between digital marketing metrics (impressions, clicks, calls) and real-world outcomes (store visits, sales, loyalty). In 2026, this is the single most important set of metrics for any business with a physical location.
Why Foot Traffic Analytics Is a Game-Changer
Traditional marketing reports focus on vanity metrics. You might celebrate 10,000 website visits or a 15% increase in “near me” impressions. But do those numbers translate to cash register revenue? Without foot traffic analytics, you’re guessing. With it, you can directly attribute store visits to specific marketing channels, identify which days and hours your visibility strategy is working (or failing), and optimize your location-based tactics for maximum conversion.
Consider this: 46% of all Google searches have local intent, and 75% of businesses report that SEO outperforms all other lead sources. Yet fewer than 30% of local businesses actively track how many direction requests actually become store visits. The businesses that do track this see conversion rates 2.5x higher than their peers, simply because they know which levers to pull.
Key Metrics and How to Use Them
Direction requests from Google Business Profile are your most immediate signal of purchase intent. A user who clicks “Get directions” is far more likely to visit than one who only views your profile. Benchmark your direction request volume against industry averages (e.g., restaurants often see 20–30 direction requests per 1,000 views). If your rate is low, investigate: is your address hard to find? Are your hours unclear?
Search queries break into branded vs. discovery searches. Branded searches (e.g., “Joe’s Pizza Broadway”) indicate existing awareness—your goal here is convenience. Discovery searches (e.g., “pizza near me”) indicate new customer acquisition—your goal here is prominence. Track the ratio between them. A healthy local business typically sees 40% branded, 60% discovery, though this varies by maturity.
Visit conversion rate is the ultimate metric. This requires additional tools like Google’s store visits conversion tracking (available for businesses with sufficient ad spend) or third-party foot traffic sensors (Euclid, Dor, or simple WiFi analytics). Measure the percentage of people who click “directions” and actually arrive within a reasonable time window (e.g., 30 minutes for restaurants, 24 hours for service businesses).
Actionable Optimization Tactics
Start with your weakest link. If direction requests are high but visits are low, check your physical signage, entrance accessibility, and first-impression clutter. If discovery queries are low, invest in local backlinks and review generation. If branded searches dominate, you’re not reaching new customers—increase local sponsorships or targeted ads.
Test one change at a time. For one week, add “Open now” attributes to your GBP. Measure direction request lift. For two weeks, post daily photos. Measure again. This iterative approach turns foot traffic analytics into a growth engine.